Incremental builds for a 1,000-crate Rust workspace without Bazel
Ryle ·
One repo I work on is a Rust workspace of about a thousand crates, and most of the commits to it come from coding agents that push, get reviewed, push a fix and push again. I wanted what Bazel gives a big C++ or Java shop: change one file, rebuild and retest only what depends on it, and never build the same thing twice anywhere. Rust doesn't really have that. This is how close I got with cargo and a few tools around it. The short version: making each change touch fewer crates did more than any cache.
What cargo gives you, and what it doesn't
Cargo is incremental, but only in a narrow sense. It fingerprints each crate and skips the ones whose inputs didn't change, and rustc's incremental compilation reuses work inside a crate you edited. All of that lives in one target directory on one machine, so a fresh CI pod or a new build server starts cold. Feature unification also depends on which packages are in the same cargo invocation, so building a different set of packages can recompile crates you thought were done.
What's missing compared to Bazel or Buck2 is an action graph with a shared cache: every compile, link and test run keyed by the hash of its inputs, and reusable by any machine. The usual Rust substitutes each cover part of that:
- sccache caches rustc outputs per crate across machines, but not linking, binaries, proc-macros, dylibs or incremental compiles. When I measured it, about a third of all compile requests fell in that bucket. I switched to kache, which also caches proc-macros and restores by hardlink (numbers in the CI cost post). Neither caches the final link.
- cargo-nextest runs tests faster but doesn't remember results. Nothing standard says "these tests already passed on exactly this code".
- Picking what to test is left to you.
cargo metadatagives you the graph, and guppy's determinator does it properly. I wrote my own because I also needed to map files to deployable images.
What I looked at and didn't adopt
Bazel with rules_rust. I never seriously tried it. You maintain BUILD files next to every Cargo.toml (or generate them), handle build scripts and feature sets in a second build system, and keep rust-analyzer happy. With a thousand crates mostly written by agents that know cargo far better than Bazel, the upkeep looked bigger than the win. My note at the time called it a build-system rewrite to fix what was mostly a scheduling problem.
Buck2 with a remote execution backend. This one I planned properly. Cargo would stay the source of truth, a generator would emit BUCK files from cargo metadata (with reindeer for third-party crates), and you'd pick cargo or Buck2 per command. The porting inventory was about a thousand manifests, 1,500 third-party packages, 20 build scripts and 70 cdylib crates. Remote actions are hermetic, so there's no rustc incremental compilation, and my guess was that Buck2 would win on wide, cold and repeated builds and lose or tie on the loop agents live in: edit one crate, check, test. (My build servers already give up incremental, because the compile cache turns it off, so that loss may be smaller than I assumed.) I set go/no-go criteria, at least twice as fast on wide builds and at most 1.5 times slower on small edits, and collected a week of cargo baseline numbers. I never ran the pilot, because the cheaper fixes below kept paying off.
cargo-hakari. A workspace-hack crate forces one unified feature set everywhere, so shared dependencies stop recompiling with slightly different features. I built it out across all the workspace's crates and cargo hakari verify passed. Then I parked it. It only helps if every crate depends on the hack crate, and the cost lands on cold caches, where a one-crate PR first compiles the whole unified dependency set. It saved CPU on nodes that were mostly idle, not time on anybody's critical path.
I didn't try Nix. Crane caches the dependency layer but builds the workspace as one unit, and per-crate Nix looked like Bazel's upkeep in a different language.
What worked, ranked by impact
1. Make each change touch fewer crates
This was the biggest win, and I got to it last because I didn't measure first. When I finally did, the first-party crates costing the most CI time weren't the big ones. They were the schema crates: the 80 of them took 53% of first-party compile time, and the busiest were rebuilt about 2,300 times a week each. About four out of five crates in the workspace depended on at least one of them.
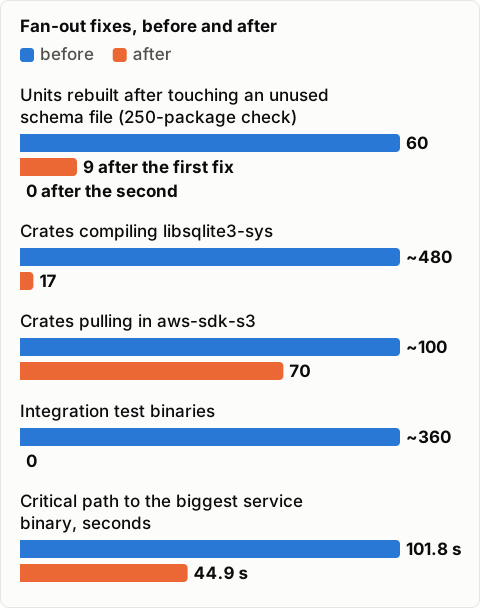
The cause was a build-script watch. Each schema crate's build.rs ran protobuf codegen and told cargo to rerun whenever anything in the definition tree (several hundred files) changed. Deleting those watch lines from the build scripts did nothing, because the real watch came from a shared helper that printed one for every file it read. One crate emitted 940 watch lines for the 29 files it compiled. Watching only the files a crate actually compiles took one test (touch an unrelated definition file, then check a 250-package tree) from 60 units rebuilt to 9. Narrowing the one crate that globbed about 170 definitions to expose 50 took it to 0. Later I removed protobuf entirely, which deleted the build scripts, and separately moved about 160 crates off an aggregate schema crate that re-exported dozens of others.
The same pattern showed up in dependencies:
sqlitewas enabled on the workspace-widesqlxdependency, so nearly 500 crates compiled the SQLite C library. Five actually used it. After moving the feature to them, 17 crates still compile it.- Two "funnel" crates pulled the AWS S3 SDK into graphs that never talk to S3. Feature-gating one module and splitting a client crate out of the other took it from about 100 crates to 70.
- Four accidental dependency edges put the whole CI and ops stack on the main service binary's build path. Cutting them took that binary's critical path (the longest chain of compiles, weighted by real per-crate times) from 101.8 seconds to 44.9, and its build from 1,477 units to 1,080.
- The workspace had about 360 integration-test binaries in about 140 crates, each a separate link of its crate's whole dependency tree. One service alone had 44, about 330 seconds of a 2,000-second
cargo test. All of them moved into inline#[cfg(test)]modules, and a hook now refuses new ones. Agents follow a hook far more reliably than a rule in a prompt.
The biggest crates got split too. The main service crate was about 83,000 lines and averaged 430 seconds per build, so I carved it into four library crates behind a thin binary. Profile settings helped at the margins: codegen-units = 16 instead of 1 for release, lto = "off" rather than false (which still runs a local ThinLTO pass, 192 to 292 seconds on one crate), mold as the linker, and debug = "line-tables-only" in the dev profile, because debug sections were a quarter of the bytes in the largest rlibs.
2. Keep the target directories warm
Next was making sure builds happen somewhere that has already done most of the work. Builds and CI go to a few remote build servers that keep a persistent target directory per slot and a shared compile cache on local NVMe. Pushes to the same PR go back to the same server when they can, so cargo's fingerprints skip most crates and the cache restores most of the rest. A warm build of a service crate took 19 to 77 seconds there. When CI ran inside the agents' own pods, the worst runs took 99 minutes. Over a later week of about 14,000 build-server requests, the median cargo build took 47 seconds and the median test run 136, with 95th percentiles of 342 and 800 seconds. In a similar week the compile cache hit about 78% of crates.
One surprise: on a warm build, much of the time went into computing cache keys, not compiling. At one point 89% of a cache hit's time was the key. My first theory was hashing large dependency rlibs. Later profiling pointed at rustc's dependency discovery pass instead. Either way, a cache isn't free.
3. Test only what a change can affect
The planner diffs a PR against its merge base and maps changed files to crates and to the source paths each deployable image is built from. Work is grouped into units, roughly one per image plus a catch-all for library crates no image owns. (The catch-all came after an earlier version let library-only changes merge without ever being compiled.) A diff that only touches Cargo.lock compiles a few binaries whose dependency trees cover most of the workspace.
Downstream crates were the hard part. A change to a schema crate used to get a compile check of just three important downstream binaries, picked by walking cargo metadata in reverse, because everything downstream was most of the repo. That let a break through. A new field on a schema struct broke a library that built that struct with a full struct literal, none of the three binaries depended on that library, and nobody found out until publishing. Now a schema change compiles every crate downstream of it, library and binary targets only, without tests. After the fan-out fixes, that was affordable. Each unit then runs as one cargo nextest invocation, and if it fails, reruns on subsets binary-search for the crate responsible.
4. Don't rerun tests that already passed
The planner works per PR, so a review-and-fix loop of three to six pushes ran the same tests three to six times, and the run after merge ran them again. So before a unit's tests run, it computes a blake3 fingerprint of everything that can affect them: the blob hashes (from one git ls-files -s) of every file in its crates and their transitive workspace dependencies, including dev and build edges, plus Cargo.lock, toolchain versions and a format version. If a green result exists at that fingerprint, the tests are skipped.
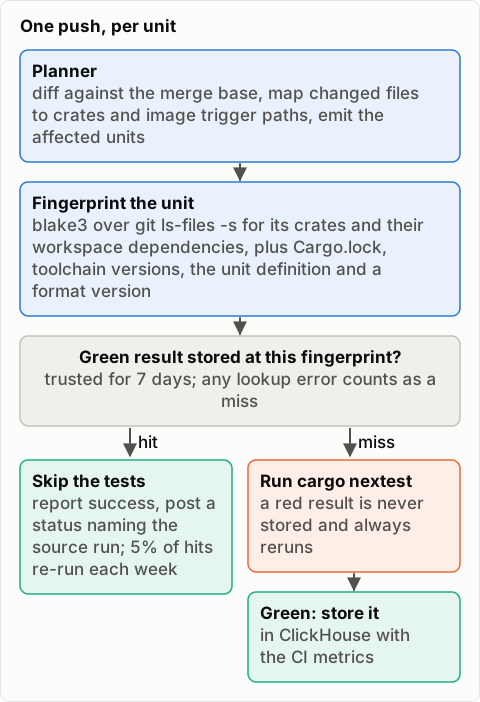
Only green results are stored. They expire after 7 days, 5% of hits rerun anyway as a check, and any lookup error counts as a miss. I skipped the shadow period I'd planned and went live on day one, but every run still logged its would-skip decision next to the real outcome. Over the first 16 days that was 11,939 rows, 3,631 would-skip hits and 3 false hits, all of which look like flakes. That's about a 30% skip rate, though the rows mix modes, so treat it as rough. The one real bug was a missing input: build dependencies weren't in the fingerprint. The format version in the hash is what made that safe to fix.
What the measurements said
A few weeks in, I finally pulled a week of runner metrics:
| Bucket, 7 days | Hours |
|---|---|
| Runner wall-clock, all jobs | 1,409 |
| in runs that ended in failure | 1,050 (75%) |
| in runs that ended in success | 359 |
cargo build inside those jobs | 433 |
| first-party crates | 162.5 |
| of which, the 80 schema crates | 86.2 (53%) |
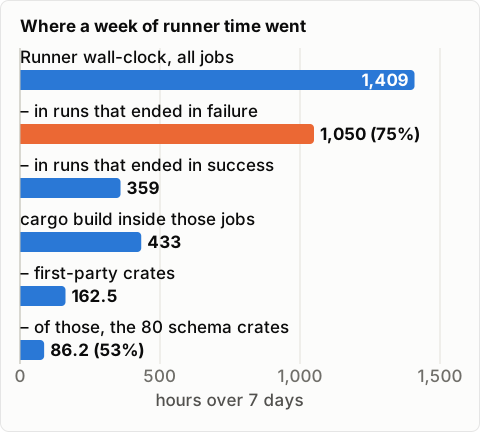
The schema line is what sent me after the fan-out fixes. The 75% is the uncomfortable part. A cache that only stores green results can't touch runs that end red, and those were most of the time. With agents, a red PR usually gets several failing runs before a green one, and each pays for the same compiles as a passing run. Fan-out fixes make every run cheaper, red or green, which is part of why they ranked first. Three other things helped. A new push now cancels the PR's older runs. CI had done that on the old runners, but it was lost when CI moved, and at one point a single PR had four runs going when only the newest would ever be read. Heavy units start first, and the first failure stops new ones from launching. And flaky tests go into a ledger and stay red, instead of being retried until they pass.
Two things I didn't do. I never recomputed the 75% after CI moved to the build servers, which happened the same week, so I don't know the share today. And I haven't put a quick cargo check in front of the slow units, so a change that doesn't compile still finds out after a long build. That's the next thing I'd do. (One caveat on the table: the per-crate numbers only record the 50 slowest compile units per build, so cheap crates used everywhere barely show up.)
What I'd do again
- Measure first. I built the test cache first because repeated green runs were the waste I could see. The data said fan-out and failing runs were bigger.
- Shrink fan-out before adding caches. Look for broad
rerun-if-changedwatches, workspace-wide features only a few crates need, aggregate crates that re-export everything, andtests/*.rsbinaries. Measure reach withcargo tree -i <crate>per member, sincecargo metadata's resolve unions features and overcounts. - Keep builds on warm machines and route repeat work for the same branch back to the same one.
- Give the compile cache telemetry on day one. For a few weeks mine had none, and I misread a fallback cache's hit rate as the real one.
- Make every cache fail open and version its keys. All the mistakes I made with the test cache were recoverable because of those two things.
- Keep cargo as the source of truth. If I do move to Buck2 or Bazel, it'll be with generated build files and cargo still the default. I don't want to hand-maintain a second build graph for a thousand agent-written crates.